import pandas as pd
# --- dataset 2: 3 columns and rownames
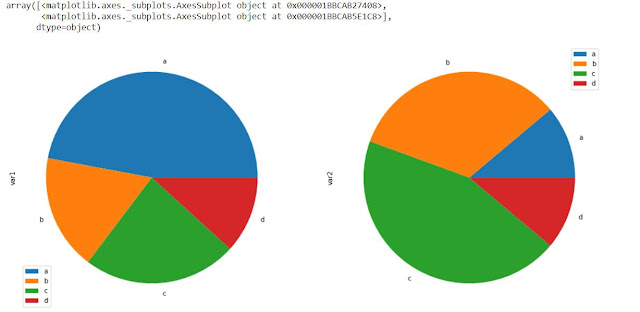
df = pd.DataFrame({'var1':[8,3,4,2], 'var2':[1,3,4,1]}, index=['a', 'b', 'c', 'd'] )
# make the multiple plot
df.plot(kind='pie', subplots=True, figsize=(16,8))


# --- dataset 2: 3 columns and rownames
df = pd.DataFrame({'var1':[8,3,4,2], 'var2':[1,3,4,1]}, index=['a', 'b', 'c', 'd'] )
# make the multiple plot
df.plot(kind='pie', subplots=True, figsize=(16,8))
import pandas as pd
# --- dataset 2: 3 columns and rownames
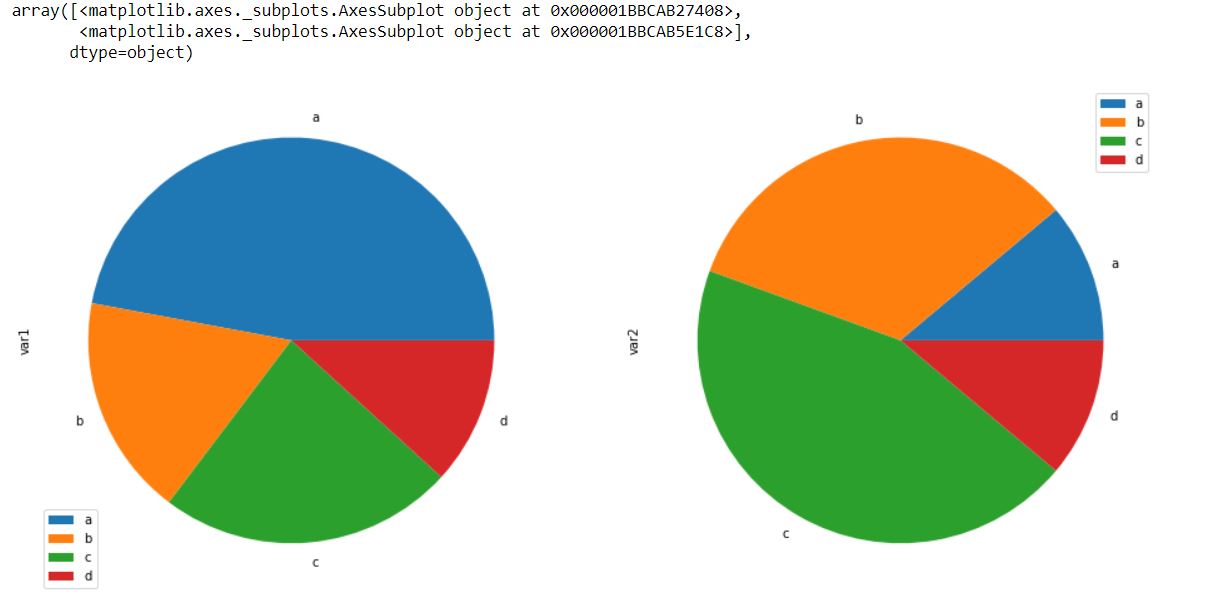
df = pd.DataFrame({'var1':[8,3,4,2], 'var2':[1,3,4,1]}, index=['a', 'b', 'c', 'd'] )
# make the multiple plot
df.plot(kind='pie', subplots=True, figsize=(16,8))
Out[3]:
In [7]:
import pandas as pd

# --- dataset 2: 3 columns and rownames
df = pd.DataFrame({'var1':[4,4,4,4], 'var2':[1,3,4,1]}, index=['a', 'b', 'c', 'd'] )

# make the multiple plot
df.plot(kind='pie', subplots=True, figsize=(16,8))
Out[7]:
In [8]:
import pandas as pd

# --- dataset 2: 3 columns and rownames
df = pd.DataFrame({'var1':[4,4,4,4], 'var2':[1,3,4,1]}, index=['a', 'b', 'c', 'd'] )

# make the multiple plot
df.plot(kind='pie', subplots=True, figsize=(10,8))
Out[8]:
In [9]:
import pandas as pd

# --- dataset 2: 3 columns and rownames
df = pd.DataFrame({'var1':[4,4,4,4], 'var2':[2,3,4,1]}, index=['a', 'b', 'c', 'd'] )

# make the multiple plot
df.plot(kind='pie', subplots=True, figsize=(10,8))
Out[9]:
In [ ]:


No comments:
Post a Comment