import numpy as np
import matplotlib.pyplot as plt
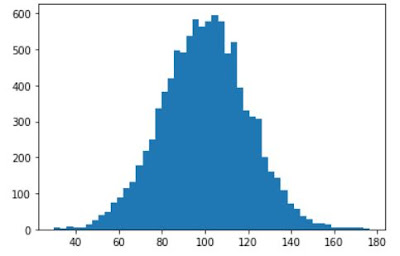
income= np.random.normal(100.0,20.0,10000)
plt.hist(income,50)
plt.show()
output:
income.std()

import matplotlib.pyplot as plt
income= np.random.normal(100.0,20.0,10000)
plt.hist(income,50)
plt.show()
output:

income.std()
19.99095786583713
import numpy as np
import matplotlib.pyplot as plt

income= np.random.normal(100.0,30.0,10000)

plt.hist(income,50)
plt.show()


No comments:
Post a Comment