from scipy.stats import norm
import matplotlib.pyplot as plt
import numpy as np
x=np.arange(-3,3,0.001)
plt.plot(x,norm.pdf(x))
plt.show()
output:

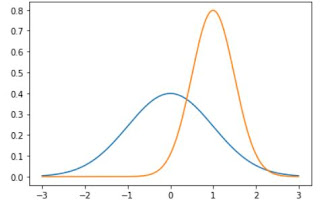
Multiple plots in one diagram:
plt.plot(x,norm.pdf(x))
plt.plot(x,norm.pdf(x,1.0,0.5))
plt.show()
save the plot in file
output:
how to save the plots in folders:
plt.plot(x,norm.pdf(x))
plt.plot(x,norm.pdf(x,1.0,0.5))
plt.savefig('C:\\Users\\Onyx1\\Pictures\\matplotlib\\matplot_two_plot.jpg', format='jpg')
import matplotlib.pyplot as plt
import numpy as np
x=np.arange(-3,3,0.001)
plt.plot(x,norm.pdf(x))
plt.show()
output:

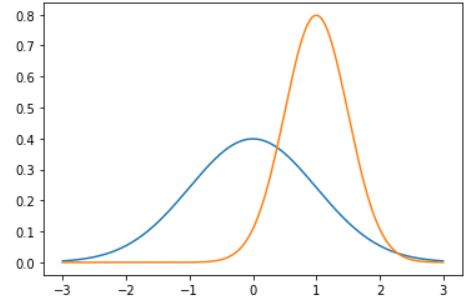
Multiple plots in one diagram:
plt.plot(x,norm.pdf(x))
plt.plot(x,norm.pdf(x,1.0,0.5))
plt.show()
save the plot in file
output:
how to save the plots in folders:
plt.plot(x,norm.pdf(x))
plt.plot(x,norm.pdf(x,1.0,0.5))
plt.savefig('C:\\Users\\Onyx1\\Pictures\\matplotlib\\matplot_two_plot.jpg', format='jpg')


No comments:
Post a Comment